Handmade Woolen carpet export down and Synthetic grow 20 %
Exports of Handicrafts
Delhi As per export statistics maintained by this office in respect of handicrafts and handmade carpets, both production and exports have shown increasing trend.
The details of category-wise exports of handicrafts and handmade carpets for F.Y’s 2016-17, 2017-18 & 2018-19
Export of Handicrafts and Handmade Carpet for the period 2016-17 to 2018-19
| (Rupees In Crores & USD Million) | ||||||||
| ITEMS | 2016-17 | 2017-18 | 2018-19 | CAGR (2016-17 to 2018-19) | ||||
| (April-March) | (April-March) | (April-March) | ||||||
| Incrores | USD Million | In crores | USD Million | In crores | USD Million | In crores | USD Million | |
| A. Handicrafts. | ||||||||
| 1. Art Metal ware | 4705.64 | 702.51 | 3955.81 | 613.73 | 3762.79 | 538.24 | -10.58% | -12.47% |
| 2. Wood wares | 3916.01 | 584.09 | 4267.37 | 662.47 | 5424.91 | 775.99 | 17.70% | 15.26% |
| 3. Hand printed Textiles & Scarves | 3847.40 | 573.85 | 3665.00 | 568.62 | 3483.16 | 498.24 | -4.85% | -6.82% |
| 4. Embroidered & Crocheted goods | 3227.00 | 481.05 | 3305.16 | 512.79 | 3925.97 | 561.58 | 10.30% | 8.05% |
| 5. Shawls as art ware | 3.85 | 0.57 | 5.06 | 0.83 | 7.02 | 1.00 | 35.03% | 32.45% |
| 6. Zari & Zari goods | 69.02 | 10.30 | 98.69 | 15.37 | 130.02 | 18.60 | 37.25% | 34.38% |
| 7. Imitation Jewellery | 1619.09 | 241.59 | 1540.80 | 239.05 | 1930.40 | 276.13 | 9.19% | 6.91% |
| 8. Agarbatties& Attars | 912.50 | 136.19 | 982.82 | 152.48 | 966.22 | 138.21 | 2.90% | 0.74% |
| 9. Misc. Handicrafts | 6091.89 | 908.90 | 5208.64 | 808.15 | 6959.76 | 995.56 | 6.89% | 4.66% |
B. Carpet & other Floor Coverings. | ||||||||
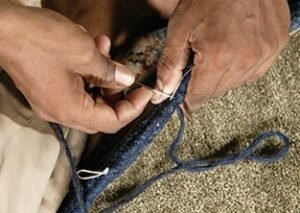
1. Handmade Woolen | 9249.8 | 1379.5 | 8361.9 | 1296.4 | 9189.1 | 1324.5 | -0.33% | -2.02% |
2. Silk | 63.8 | 9.5 | 17.4 | 2.7 | 24.2 | 3.5 | -38.45% | -39.51% |
3. Synthetic | 688.3 | 102.7 | 826.7 | 128.2 | 994.7 | 143.4 | 20.21% | 18.18% |
| Grand Total (A+B) | 34394.3 | 5130.8 | 32235.3 | 5000.8 | 36798.2 | 5274.9 | 3.44% | 1.39% |
| The data of exports from 2016-17 to 2018-19 are as per data of DGCI&S, Kolkata. | ||||||||
This information was given by the Union Minister of Textiles,


